

3 a.m. The phone buzzes. The api-server pod is crash-looping in production.
I open my laptop, SSH into the cluster, run kubectl logs, inspect events, query Prometheus, and look up the runbook — and 15 minutes later, I finally identify the root cause. This scenario happens at least once a week. And every time it does, the same question comes up: why can’t this part be automated?
The information is already there. Prometheus is collecting metrics. Logs are being stored. The runbook has already been written. The only thing missing is an AI smart enough to connect all the pieces and produce an answer before I even finish making a cup of coffee.
That is why I built SRE Agent v3.0 — an AI agent that runs 24/7, automatically detects, investigates, and alerts on incidents in Kubernetes, using GPT-4o through GreenNode MAAS and running on VKS (VNG Kubernetes Service).
What you will build
- An AI agent that receives alerts from Prometheus, investigates the cluster on its own, and sends a full report to Teams within 30 seconds.
- 16 kubectl, PromQL, and GitHub tools that GPT-4o can call automatically in a logical sequence.
- 13 runbooks used as a knowledge base, so the AI looks things up instead of hallucinating fix steps.
- A Telegram bot that lets you issue commands in Vietnamese from your phone, without needing a public IP.
- A Helm chart that deploys to any Kubernetes cluster with a single command.
Prerequisites
kubectlis already connected to a Kubernetes cluster, whether VKS or any other cluster.- Docker and Helm are installed.
- A GreenNode MAAS API key, registered via portal.
- A GitHub Personal Access Token with
Contents: Readpermission. - A 16-character Gmail App Password, not your regular Gmail password.
GreenNode MaaS exposes an OpenAI-compatible API, so the entire codebase uses the standard OpenAI SDK — you only need to change the
base_url. There is no new SDK to learn.
High-level architecture
Before getting into the code, I want to explain the most important design decision: why split the system into four separate blocks instead of building a monolith.
Each block can be replaced independently. If you use Slack instead of Teams, you only need to replace the Notification block. If your team already has its own runbook system, you only need to replace the Knowledge block. The GPT-4o core remains unchanged.
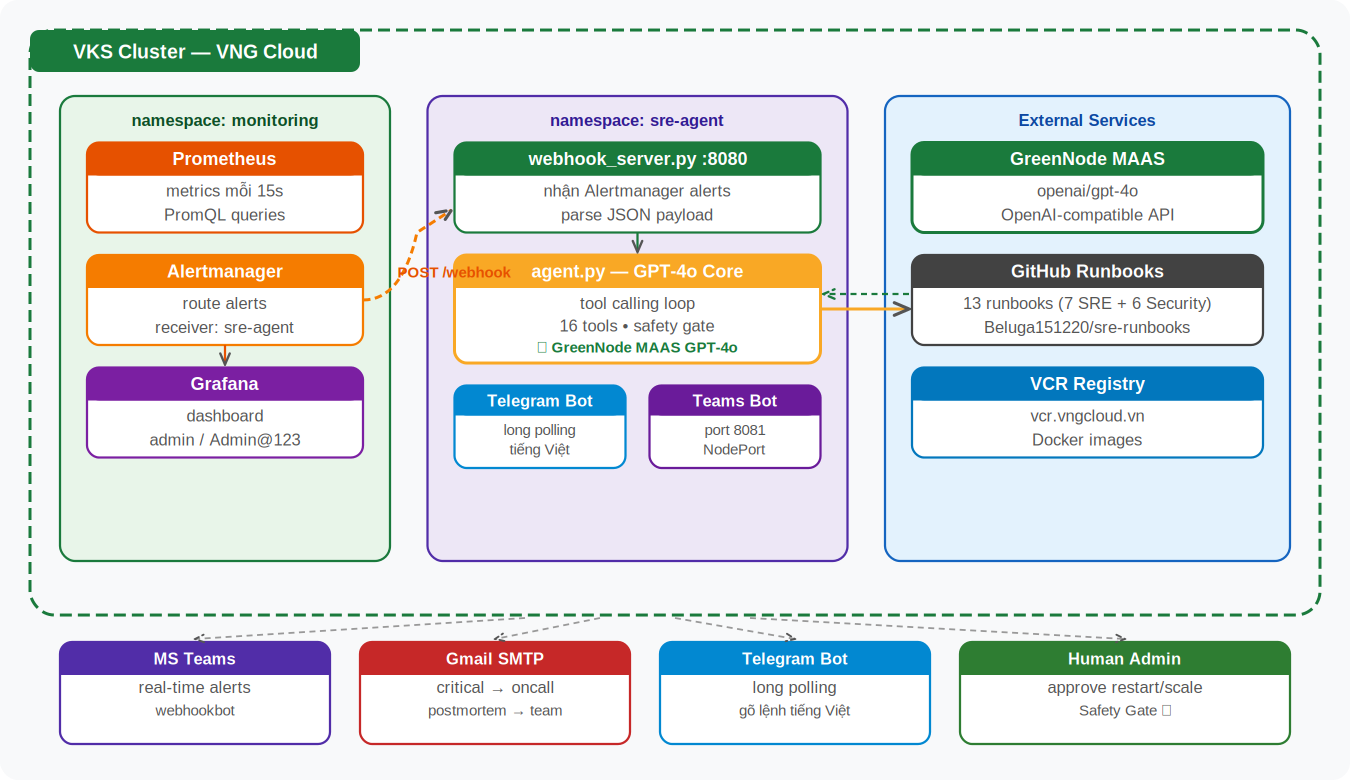
Figure 1: High-level architecture of SRE Agent v3.0 — VKS, VNG Cloud
| Block | Components | Responsibility |
|---|---|---|
| Monitoring | Prometheus + Alertmanager | Collects metrics every 15 seconds. When a threshold is exceeded, it sends a POST /webhook request to the SRE Agent. Engineers do not need to do anything at this stage. |
| Brain | GPT-4o / GreenNode MAAS | Analyzes the context and decides which tools to call, and in what order. This is the only part that actually “thinks” — everything else just executes. |
| Knowledge | 13 runbooks on GitHub | The AI does not hallucinate fix steps. It looks them up in runbooks written by the team itself. This is the biggest difference compared to a typical chatbot. |
| Notification | Teams + Gmail + Telegram | Engineers do not receive “there is an issue,” but “here is the issue, the root cause, and the fix steps.” They get full context before even opening their laptop. |
Step-by-step guide
Step 1 — Install the Prometheus stack
Why start with Prometheus instead of writing the agent first? Because the agent is only useful if it has a reliable alert source. Prometheus and Alertmanager are the “sensors” layer — without them, the agent has no idea when it needs to act.
helm repo add prometheus-community \
https://prometheus-community.github.io/helm-charts
helm repo update
kubectl create namespace monitoring
helm install kube-prom \
prometheus-community/kube-prometheus-stack \
--namespace monitoring \
--set grafana.adminPassword=Admin@123
kube-prometheus-stack installs Prometheus, Alertmanager, Grafana, and more than 40 prebuilt alert rules for Kubernetes all at once. You do not need to write alert rules from scratch — CrashLoopBackOff, OOMKilled, and NodeNotReady are already included.
After installation, get the Prometheus service name so you can put it in
.env:kubectl get svc -n monitoring | grep prometheus
Step 2 — Configure credentials
This is the step that tends to cause the most errors. I’ll explain why each variable is needed and where to get it, instead of just listing them.
# GreenNode MAAS --- OpenAI-compatible API endpoint
MAAS_URL=https://maas-llm-aiplatform-hcm.api.vngcloud.vn/v1/
MAAS_API_KEY=vn-YOUR_KEY # get it at greennode.ai → AI Platform
MAAS_MODEL=openai/gpt-4o
# Internal Prometheus URL inside the cluster
PROMETHEUS_URL=http://kube-prom-kube-prome-prometheus.monitoring.svc.cluster.local:9090
# GitHub --- used to search runbooks
GITHUB_TOKEN=ghp_xxx # Settings → Developer → Fine-grained token
RUNBOOK_REPO=YOUR_USERNAME/sre-runbooks
RUNBOOK_PATH=runbooks
# Teams webhook
TEAMS_WEBHOOK_URL=https://webhookbot.c-toss.com/api/bot/webhooks/YOUR_ID
# Gmail --- MUST use an App Password, not your regular password
SMTP_HOST=smtp.gmail.com
SMTP_PORT=587
SMTP_USER=your@gmail.com
SMTP_PASSWORD=xxxx xxxx xxxx xxxx # myaccount.google.com/apppasswords
EMAIL_ONCALL=oncall@company.com
# Telegram
TELEGRAM_BOT_TOKEN=YOUR_TOKEN
TELEGRAM_ALLOWED_CHAT_IDS=YOUR_CHAT_ID
SMTP_PASSWORDmust be a 16-character App Password — Google disabled regular password access in 2022. If you use the wrong one, you will get a535error and may not understand why.
Step 3 — Build the agent core with tool calling
This is the most important part. The core idea behind tool calling is this: instead of hard-coding “when you receive a CrashLoopBackOff, call get_pod_logs,” you tell GPT-4o which tools are available and let it decide the order on its own.
That matters more than it sounds. A CrashLoopBackOff alert and a NodeNotReady alert need to be investigated in completely different ways. A hard-coded workflow will never cover every case. Letting GPT-4o reason through the workflow is what makes it flexible.
from openai import OpenAI
# Point to GreenNode MAAS instead of api.openai.com
client = OpenAI(
    base_url='https://maas-llm-aiplatform-hcm.api.vngcloud.vn/v1/',
    api_key=os.getenv('MAAS_API_KEY'),
)
def run_agent(message, history=None):
    history = history or []
    history.append({'role': 'user', 'content': message})
    while True:  # loop until there are no more tools to call
        resp = client.chat.completions.create(
            model='openai/gpt-4o',
            messages=[SYSTEM_PROMPT] + history,
            tools=TOOLS,  # 16 predefined tools
            tool_choice='auto',  # GPT-4o decides automatically
        )
        msg = resp.choices[0].message
        if not msg.tool_calls:  # no more tools → return final result
            return msg.content, history
        for tc in msg.tool_calls:
            # Safety Gate: ask for approval before changing the cluster
            if tc.function.name in {'restart_deployment', 'scale_deployment'}:
                confirm = input(f'⚠️ {tc.function.name} --- Execute? (yes/no): ')
                if confirm != 'yes':
                    continue
            result = execute_tool(tc.function.name, tc.function.arguments)
            history.append({'role':'tool','tool_call_id':tc.id,'content':result})
The Safety Gate is not there because AI is untrustworthy. It is there because every change to a production system must have a human owner. That is a principle, not an optional feature.
Step 4 — Build the knowledge base with runbooks
Runbooks are what separate an agent that gives generic answers from one that tells you exactly what to do. The naming rule is simple: the filename should match the alertname in Prometheus.
Here is a real example from OOMKilled.md in my repo:
## Description
The pod was killed by the Linux kernel because it exceeded its memory limit. Exit code 137.
## Investigation
kubectl describe pod <pod> -n <namespace>
# Look for: Last State → Terminated, Reason: OOMKilled, Exit Code: 137
kubectl top pod <pod> -n <namespace>
## Fix
kubectl set resources deployment <n> -n <namespace> \
--limits=memory=512Mi --requests=memory=256Mi
## How to choose the memory limit
1. Check peak memory usage over the last 7 days in Grafana
2. Set limit = peak × 1.5
3. Monitor for 24 hours after increasing it
Fifteen lines. It does not need to be any longer. GPT-4o reads that and immediately knows what to do with the OOMKilled pod in front of it — not in theory, but in practice.
Right now I use 13 runbooks: 7 for common SRE incidents and 6 for security incidents. The security runbooks turned out to matter more than I expected — most security alerts happen outside working hours, exactly when nobody is watching.
Step 5 — Connect Alertmanager
This step has an important pitfall that cost me two hours to debug: do not use helm upgrade to change the Alertmanager config.
The reason is that Prometheus Operator manages the Alertmanager config through a separate Kubernetes Secret. When you run helm upgrade --set alertmanager.config..., the Operator immediately overwrites it with the default config. The only reliable fix is to patch the Secret directly.
kubectl apply -f - <<'EOF'
apiVersion: v1
kind: Secret
metadata:
  name: alertmanager-kube-prom-kube-prometheus-alertmanager
  namespace: monitoring
stringData:
  alertmanager.yaml: |
    receivers:
    - name: sre-agent
      webhook_configs:
      - url: http://sre-agent.sre-agent.svc.cluster.local:8080/webhook
    route:
      receiver: sre-agent
      routes:
      - matchers: [alertname = "Watchdog"]
        receiver: "null"
EOF
kubectl rollout restart statefulset \
alertmanager-kube-prom-kube-prometheus-alertmanager -n monitoring
After this step, every time Prometheus fires an alert, Alertmanager sends a POST request to the SRE Agent. Engineers do not need to do anything else.
Step 6 — Deploy with Helm
I packaged the whole thing as a Helm chart so deploying to a new cluster takes just one command. All configuration lives in values.yaml — there is no need to edit any other files.
# Fill in credentials in values.yaml
nano sre-agent-helm/values.yaml
# The script automatically:
# ✅ Installs kube-prometheus-stack (if not already installed)
# ✅ Deploys the agent + RBAC + Services
# ✅ Configures Alertmanager → Agent webhook
chmod +x sre-agent-helm/deploy-new-cluster.sh
./sre-agent-helm/deploy-new-cluster.sh
# Verify
kubectl get pods -n sre-agent
# Expected: sre-agent-xxx 1/1 Running
Deploying to a brand-new cluster from scratch takes about 5 minutes. After that, you only need to switch
KUBECONFIGand run the script again.
Incident workflow — 7 steps in 30 seconds
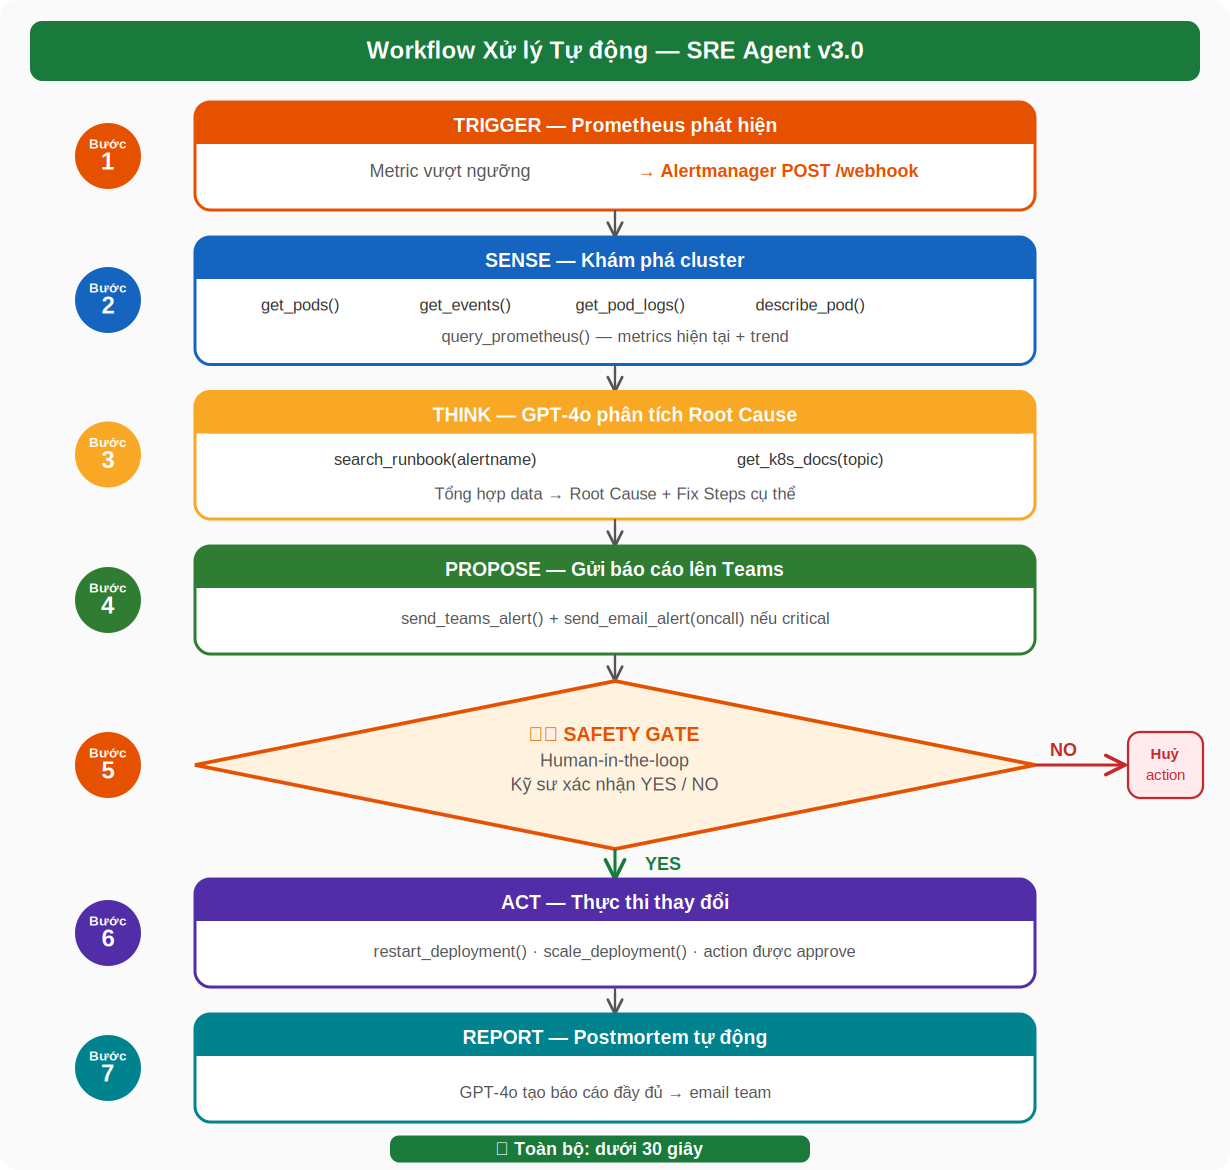
Figure 2: Automated workflow — from alert to postmortem
Looking at the diagram, you can see that most of the workflow is data collection and analysis. Execution only happens after a human confirms it. That is intentional by design: the agent handles the parts that do not require judgment, while the engineer keeps the parts that do.
Two steps matter the most.
Step 3 — THINK: When I first built this, I had the agent dump all logs, events, and metrics into a single prompt. GPT-4o often got distracted by irrelevant warnings and produced the wrong root cause. The fix was to make the agent gather data from broad to specific, fetching more only when needed. The default sequence is: get_pods → get_events → get_pod_logs → query_prometheus → search_runbook.
Step 5 — SAFETY GATE: Every action that changes the cluster, such as restart or scale, must go through an approval prompt first. Not because AI is inherently unreliable, but because every production change needs a human to own it.
Case study: PrivilegedContainer at 3:38 a.m.
This was a real alert during testing. I am keeping the timeline intact so you can see exactly what the agent did, second by second.
Alert: PrivilegedContainer · Severity: critical · Namespace: default
03:38:44 — Alert firing
Alertmanager sends POST /webhook to the SRE Agent.
03:38:45 — Agent starts
get_pods(namespace='default') — returns the list of pods.
03:38:47 — Runbook lookup
search_runbook('PrivilegedContainer') — finds the correct PrivilegedContainer.md file.
03:38:51 — GPT-4o analysis
It identifies 6 pods running with privileged=true in the default namespace.
03:38:54 — Send to Teams
send_teams_alert(severity='critical') — posts the message to the channel.
03:38:55 — Email on-call
send_email_alert(to='oncall') — because severity=critical.
[CRITICAL] Security Incident: PrivilegedContainer
Time: 2026-04-10 03:38:44 | Action Required: Immediate isolation
Pods involved:
nginx-nfs-84ccf7c785-kjzsl·nginx-nfs-84ccf7c785-kp9hk·test-nfs-writer·whisper-large-v3-5b9f4b7b59-hxfsr·whisper-large-v3-new-c4bf47fc-p9dfl
The total time from the alert firing to the engineer receiving a full-context notification was 11 seconds.
More importantly than the number itself, the engineer receives a message that immediately tells them what to do. It is not “there is an issue.” It is “these are the pods running privileged; check the runbook and isolate them.” No laptop-first investigation required.
Telegram bot — operating the cluster from your phone
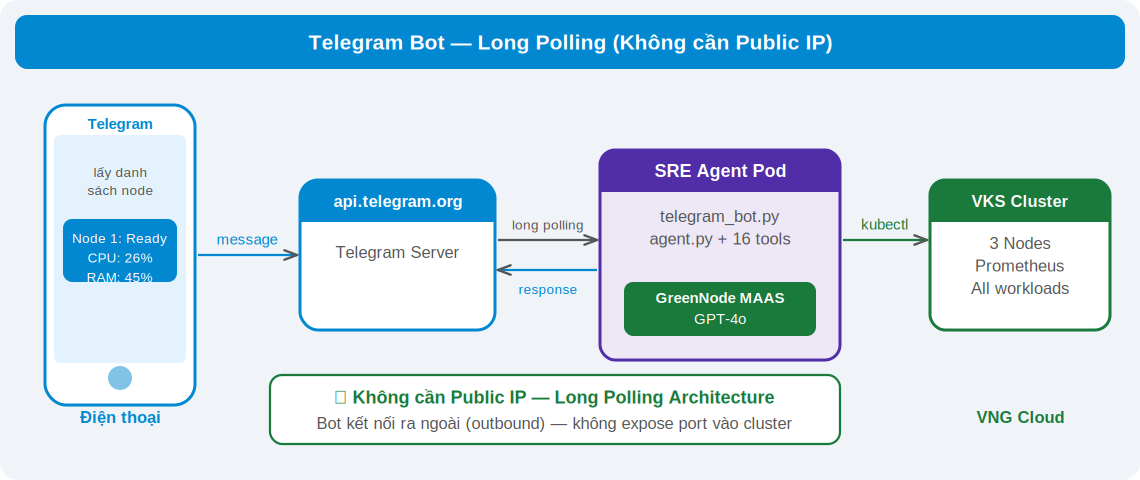
Figure 3: Telegram bot using long polling — no public IP required
The Telegram bot uses long polling: instead of waiting for a webhook, it actively pulls messages from api.telegram.org. That means no internet-exposed port, no public IP, and no firewall rule. The bot simply runs inside the cluster like any other process.
User: show me the node list
Bot: Node 1: Ready (CPU: 26%, RAM: 45%)
Node 2: Ready (CPU: 15%, RAM: 50%)
Node 3: Ready (CPU: 31%, RAM: 62%)
The cluster is operating normally.
User: which pods are having issues in production
Bo: [automatically calls
get_pods + get_events]Found 2 pods that need attention:
•
api-server: restarted 15 times in the last hour (CrashLoopBackOff)•
worker-queue:OOMKilled3 times recently
The input is just natural Vietnamese. GPT-4o understands the intent and decides which tools to call — there is no fixed command syntax.
Telegram bot setup in 3 steps
- Open Telegram, search for
@BotFather, run/newbot, and copy the token. - Send
/startto the bot, then get thechat_idwith:curl 'https://api.telegram.org/botTOKEN/getUpdates' - Add
TELEGRAM_BOT_TOKENandTELEGRAM_ALLOWED_CHAT_IDSto.env, then delete and recreate the Secret, and restart.
TELEGRAM_ALLOWED_CHAT_IDSmust not contain spaces after the ID. Kubernetes reads the.envfile literally, so the chat ID will not match and the bot will block everyone.
Testing and troubleshooting
Verify the system is working
After deployment, run a manual test alert to confirm the full pipeline works end to end.
kubectl run curl-test --image=curlimages/curl -it --rm \
--restart=Never -n sre-agent -- \
curl -X POST \
http://sre-agent.sre-agent.svc.cluster.local:8080/webhook \
-H 'Content-Type: application/json' \
-d '{"alerts":[{"status":"firing",
"labels":{"alertname":"CrashLoopBackOff",
"namespace":"default","severity":"warning"},
"annotations":{"summary":"Test alert"}}]}'

# Watch the agent process it in real time
kubectl logs -f deployment/sre-agent -n sre-agent
If you see the agent calling get_pods → search_runbook → send_teams_alert in the logs and Teams receives the message, the pipeline is working correctly.
Common issues
| Symptom | Actual cause | Fix |
|---|---|---|
Alertmanager still sends to null | Prometheus Operator overwrites the Helm config | Patch the Secret directly — do not use helm upgrade --set. |
| SMTP Error 535 | Using a regular Gmail password | Create an App Password at myaccount.google.com/apppasswords. |
| Telegram blocks everyone | TELEGRAM_ALLOWED_CHAT_IDS contains a space | sed -i 's/TELEGRAM_ALLOWED_CHAT_IDS=.*/TELEGRAM_ALLOWED_CHAT_IDS=ID/' .env |
kubectl logs shows nothing | Python is buffering stdout | Add flush=True to all print() calls and rebuild the image. |
| Secret unchanged after update | kubectl apply does not force an update | Delete the Secret and recreate it instead of using apply. |
Results and next steps
Measured results
| Metric | Before | After SRE Agent v3.0 |
|---|---|---|
| Response time during an incident | ~15 minutes | ~30 seconds |
| Number of 3 a.m. wake-up calls | Frequent | 0 |
| Time spent writing a postmortem | 30–60 minutes | Generated automatically right after the incident |
| Missed security alerts | High, because nobody was on duty after hours | Close to zero — the agent is on duty 24/7 |
The 3 most important lessons
- Looking back, there are three things that mattered more than I expected. First, tell GPT-4o what tools exist and let it decide how to use them. The system handles unfamiliar alerts much better that way.
- Runbooks are a real knowledge base. When the AI has a concrete runbook to reference, it does not hallucinate. That is why it can suggest the right fix instead of giving vague advice.
- The Safety Gate is a design philosophy, not an extra feature. Any AI agent that can affect a production system needs a stopping point where a human makes the final decision.
Next directions I’m exploring
- If you have already built the basic agent, here are the three directions I currently think are the most valuable.
- Custom alert rules for team-specific patterns are my top priority. Built-in rules are great for common failures, but every team has its own failure patterns — deployments stuck after five minutes, latency spikes before OOM, or error rates that rise gradually. Writing alert rules for those patterns would help the agent catch incidents much earlier.
- Local docs mounted into
/app/docsare another thing I have not built yet, and I regret it. Right now the agent knows how to fixOOMKilledin the standard way, but it does not know that your team’s Service A has a special quirk, or how a similar incident was handled last month. Your incident history is probably the most valuable knowledge base the agent still cannot use. - Multi-cluster deployment is already supported by the Helm chart — you just switch
KUBECONFIGand run the script again. I have not tested it extensively yet, but in theory the setup is clean.
